
Global Warming-Awakening Of The Sleeping Giant!
If we do not acknowledge this issue now and wake up to take a stand we wont have an earth left to sleep on ..
This blog will not present detailed statistical data about Global Warming! It will present graphical proof of it's reality. This site is not to convince the skeptics but I will expose their selfish reasons for not accepting the overwhelming evidence. If mankind does not change they are facing extinction! They do have a choice, and this site will present you with those choices!

This images shows the actual measured temperature changes of the Earth from 1999 to 2008 as compared to the mean historical temperatures of the planet from 1940 to 1980. In some areas the planets temperature has increased as much as 1.7 degrees Celsius from its previous established norm.

This image is a prediction of the temperature rises on the planet if humankind does nothing to alter or change Global Warming. It is compared against the historical temperatures of the planet from 1960 to 1990. It predicts that the planets temperature in some areas will increase as much as 7 degrees Celsius from the established norms from 1960 to 1990.
The next series of photos will show indisputable proof that glacial ice sheets are disappearing at accelerating rates all over the world.

This photo shows satellite images of the Arctic ice caps from 1979 to 2007. It appears to have lost nearly 40% of its original mass in 28 years!

In 85 years the glacier at Bear Glacier in Alaska has nearly disappeared. "Image created by Robert A. Rohde / Global Warming Art"

The McCarthy Glacier in Alaska has completely disappeared in 95 years. "Image created by Robert A. Rohde / Global Warming Art"

In Alaska the Northwestern Glacier has completely disappeared in 96 years. "Image created by Robert A. Rohde / Global Warming Art

The Upsala Glacier in Patagonia, Argentina. Pictures contrasting 1928 with 2004 show the extent to which the glacier has melted away over 76 years.
.jpg)
Melt maps from satellites show that on July 8, 2012 about 40 percent of the Greenland's ice sheet’s surface had some melting activity. By July 12, 2012 that figure had jumped to 97 percent. The melting areas are shown in red. The areas showing no melting are shown in white. These images do not mean that 97% of the Greenland ice sheet has melted away! They simply show all the places where at least some melting has occurred. Some of this melting is simply due to it being summer, and in some places there is evidence of a historic cycle of melting.
This widespread melting has not happened in the 30 years satellites have been used to map the region. About half the ice on Greenland normally experiences some melting.
Scientists say such melts might occur every 150 years. If such rapid thaws become common, they could add to already rising seas.
.jpg)
Glaciers in the Tibetan Plateau are receding fast, which will result in massive flooding followed by severe drought. This picture shows the glacial melting on the west Rongbuk Glacier over 87 years between 1921 and 2008. Some reports suggest that Tibet’s glaciers have shrunk by 6,600 sq. km in the past 40 years and 82% of the glaciers have already retreated in the past 50 years (Courtesy: RGS & David Breashears/GlacialWorks).

The above photographic comparisons reveal the full extent of an Alpine glacier retreat in Switzerland over 58 years. They show the glacier masses taken in 1948, 2002, and 2006 illustrating that melting has accelerated dramatically in the past few years. On average, twice as much glacier mass melted between 1991 and 2004 than between 1961 and 1990.

Within 88 years the Kyetrak Glacier in Tibet has retreated and melted so extensively that a lake has formed where once there was ice and snow. (Courtesy: Major E.O. Wheeler/David Breashears)
It is beyond my comprehension how anyone viewing these dramatic photographs can continue to deny the evidence that proves beyond any shadow of doubt that some force is causing our planet to become warmer. I have collected hundreds of photos that present irrefutable evidence proving it's reality. A few more of these photos are shown below.


Since the early twentieth century, with few exceptions, glaciers around the world have been retreating at unprecedented rates. Some scientists attribute this massive glacial retreat to the Industrial Revolution, which began around 1760. In fact, some ice caps, glaciers and even an ice shelf have disappeared altogether in this century. Many more are retreating so rapidly that they may vanish within a matter of decades. Scientists are discovering that production of electricity, along with coal and petroleum use in industry, affects our environment in ways we did not understand before. Within the past 200 years or so, human activity has increased the amount of carbon dioxide and other greenhouse gases released into the atmosphere.

PIE CHART 01: This chart shows the accumulative emissions since 1750 to present times. Official documents released by the United States dissagree with these figure indicating that the United States is contributing less than 20% of total global emissions. Does it really matter. It is all bad and reflects the need for all industralized countries to radically reduce these industrial pollutants.

CHART 01: This chart shows what sectors of our culture are contributing to the annual greenhouse emissions. The smaller circles at the bottom of the chart show the percentage of emissions for each type of pollution. The colors in the smaller charts are linked to the colors in the larger chart. Take Carbon Dioxide as an example. The red color in that chart indicates that 29.5% of Carbon Dioxide emissions come from Power Stations.

Green House gases are also produced by appliances and simple everyday activities that we assume are harmless. Traveling from home to work or the grocery store adds to Green House emmisions from our personal vehicles.
The next series of photographs show what the industrial environment was like in the early years of the industrial revolution that started in 1750.

The next series of photographs show what the industrial environment is like in our modern world.

Sadly, you can see little difference between the photographs from the beginning of our industrial revolution and the photographs of our industrial environment in 2012! Let us assume that our industrial activities are the direct cause of Global warming.

This drawing is presented for those of you that do not understand the mechanisim behind Global warming. Take a few moments to look at CHART 01 above which shows the types of "Greenhouse Gases" that are being emitted into our atmosphere as a result of our normal industrial environment.
These gases accumulate in the atmosphere surrounding our planet and act like a mirror to reflect heat from our planets surface back down to the surface of our planet heating it up more. If these gases were not present in our atmosphere the reflected heat from our planet would normally pass through our atomoshere into space. The more "Greenhouse Gases" in our atomosphere the more heat is reflected back to the surface causing an accelertion of Global Warming!
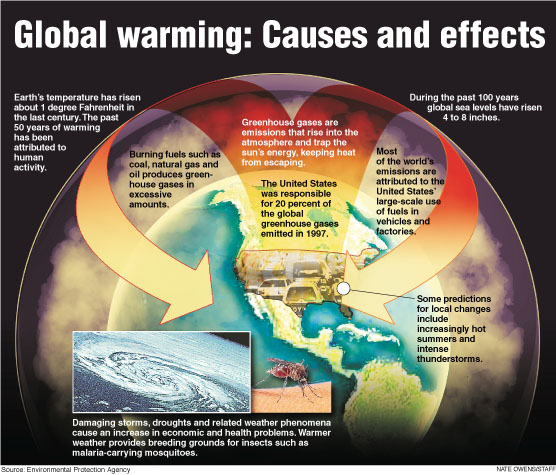
This drawing was put together by our U.S Environmental Protection Agency. It presents the effects of "Global Warming" in another way that enhances the illustration preceding it. Note that the EPA indicates that the United States contribution to overall global warming is 20% and not the 26.8% shown in the "PIE CHART 01".
Even as I write this blog there are scientific papers being written that claim there is no Global Warming, and never will be! How foolish these people are to ignore the massive amounts of physical evidence proving them wrong. Their motives for presenting such falsification of information and delaying actions to reduce and even stop the impact of Global Warming must be exposed. The answer is simple and obvious. Just as our politicians in Washington have been bought and paid for by lobbyists representing the interests of the super rich, these individuals have been bought and paid for by these same super rich elitists to destroy the credible evidence for Global Warming.
Why are they doing this? As usual, its all about MONEY! If strict environmental regulations are imposed upon them they must take money from their profits to reduce the greenhouse emissions coming from their businesses. This would be sacrilegious to those who worship the god of power and money! This problem is not confined just to the United States, it is tightly woven into the economies of every country worldwide. The super rich control the life blood of every nation and oppose anything that jeopardizes or challenges their power and wealth!
“Whatever affects one directly, affects all indirectly”. This is the key to understanding Global Warming!
Lets first look at the affects of the melting of the polar icecaps and glaciers in the mountainous regions around the world. As the glaciers in the mountainous regions melt their overflow causes flooding in the valleys below them. These glaciers presently hold about 75% of the worlds fresh water supplies. As these glaciers disappear, so does the supply of fresh water. Flooding is followed by drought. Prolonged droughts affect the food supply and changes the environment affecting animal life and vegetation. Species begin to die off and become extinct. Water is no longer available for irrigation. The entire ecosystem is changed. Hunger and disease increases as more virulent viruses adapt and change to the new and hostile environment.
We are seeing evidence of these changes everyday. The increasing droughts and forest fires that have plagued the United States in 2012 are typical examples of the shortage of water supplies and increasing temperatures from Global Warming interacting.

The above photographs are of the U.S. Drought in 2012. You see dried up lakes and riverbeds, grazing land for cattle, and crop lands. Droughts directly affect the cost of meat and vegetable products causing prices to skyrocket. “Whatever affects on directly affects all indirectly”!

These photographs are from actual forest fires that raged across the mid west and western U.S in 2012. Drought or lack of rain causes the ground foliage to die off becoming perfect kindling that is easily ignited by a spark or lightning. The result is an out of control raging forest fire that destroys and consumes everything in it's path. Besides economic devastation to populated communities, the burning process releases more greenhouse gases into the atmosphere adding to those caused by our industrial manufacturing processes. The amount is much less than those from manufacturing but it is one more source directly and indirectly increasing Global Warming.

Now lets look at the affects of the melting of our global icecaps. As they begin to melt the runoff flows directly into the oceans. The obvious and most immediate affect will be the rising of the oceans which will begin to cover low lying coastal areas of land all over the world. The Arctic icecap is currently melting at a much faster rate than Antarctica. This photo shows the projected impact of rising sea levels in coastal areas of the United States.
Global warming has raised global sea level about 8 inches since 1880, and the rate of rise is accelerating. Rising seas dramatically increase the odds of damaging floods from storm surges. A Climate Central analysis finds the odds of “century” or worse floods occurring by 2030 are on track to double or more, over widespread areas of the U.S. These increases threaten an enormous amount of damage. Across the country, nearly 5 million people live in 2.6 million homes at less than 4 feet above high tide — a level lower than the century flood line for most locations analyzed. And compounding this risk, scientists expect roughly 2 to 7 more feet of sea level rise this century — a lot depending upon how much more heat-trapping pollution humanity puts into the sky.
Source: Climate Central
A recent study says we can expect the oceans to rise between 2.5 and 6.5 feet (0.8 and 2 meters) by 2100, enough to swamp many of the cities along the U.S. East Coast. More dire estimates, including a complete meltdown of the Greenland ice sheet, pushing sea level rise to 23 feet (7 meters), enough to submerge London and Los Angeles.
Source: National Geographic Society
This phenomenon of rising sea levels is so important because it has implications that reach far beyond the flooding of coastal lands. Do you remember the quote“Whatever affects one directly, affects all indirectly”. Once again it applies to the rising sea levels and directly applies and affects another aspect of our planet that has been overlooked or minimized in the overall reinforcing feedbacks that is accelerating Global Warming. It goes to the very core of our planet's stability and is known as the Tectonic Plates. The following diagrams will explain the overwhelming role these plates have in the future of our planet.


Everyday there are more news articles describing the increasing occurrences of violent storms, flooding, drought, and other weather related phenomenon all over the world. Diseases are becoming resistant to traditional medical treatment. Animals are dying all over the world and more and more are facing extinction. These are all part of the reinforcing cycle of Global warming! “What affects one directly, affects all indirectly!”
I have already explained why the “Super Rich” do not want to do anything to stop Global Warming. It directly affects their profits.
But why haven't we the people of the world, the 99% that are directly affected by Global Warming not been able to effectively demand that our Governments do something NOW! There are an abundance of PRO-GREEN Organizations that are actively protesting around the world but they too have been unsuccessful in persuading our Governments to get serious about this eminent crisis. Why? Because we the 99% have not gotten directly involved! If we are going to make a change it will take the active participation of every 99% global citizen! It is our world, our lives, and the lives of our children and their children. The world does not belong to the Rich! It does not belong to the Governments. It belongs to we the People of the World.
WE CAN NO LONGER SIT BACK AND ASSUME THAT:
- Our personal day to day struggles and problems are more important and that we don't have time to think about Global Warming.
- The problem is too enormous and there is nothing I can do about it.
- It is someone else's problem and I have nothing to do with it.
- There is nothing that can be done to stop Global Warming.
- Global Warming will reach a peak and then begin to level off.
No comments:
Post a Comment